LinearMeter
New in version 5.0
LinearMeter ( appearanceConst ; thickness ; cornerRadius ; scaleLineOffset ; majorTickMarkOffset ; minorTickMarkOffset ; symbolOffset ; barGap ; barShape ; meterFillColor ; meterFillColorVariant ; meterBorderStroke ; meterBorderColor ; meterBorderColorVariant )
| Argument | Type | Range | Default | Note |
|---|---|---|---|---|
| appearanceConst | int | 0..127 | default | |
| thickness | num | 0..10000 | 20% | Abs or rel in percent of plot area |
| cornerRadius | num[] | 0..1000 | 0 | Abs or rel in percent of plot area |
| scaleLineOffset | num | -1000..1000 | 0 | |
| majorTickMarkOffset | num | -1000..1000 | 0 | |
| minorTickMarkOffset | num | -1000..1000 | 0 | |
| symbolOffset | num[] | -1000..1000 | 0 | |
| barGap | num | 0..100 | 0.5 | |
| barShape | int | 0..16 | 0 | |
| meterFillColor | rgba | 0..255 | none | |
| meterFillColorVariant | int | -1..128 | solid | |
| meterBorderStroke | num[] | 0..1000 | 1 | Dimension:[pt] |
| meterBorderColor | rgba | 0..255 | black | |
| meterBorderColorVariant | int | -1..128 | solid |
Description
A bar is defined by entering two values in ChartData() ; the first value defines the beginning of the bar, the second value the end. A symbol is defined by entering one value in ChartData() . Multiple bars and symbols are separated by a semicolon “;". For example:
ChartData(-10 56; /* Bar1 from -10 to 56 */
0 87; /* Bar2 from 0 to 87 */
17.5) /* Symbol at 17.5 */
The appearance of the bars and symbols can be controlled by the FillStyle() , BorderStyle() and SymbolStyle() functions. By using scale and axis functions the appearance of the scale can be controlled. Grid line and grid stripe functions make it possible to define the background behind the bar(s).
Legend and title are not supported in combination with linear meters.
| | LINEAR_METER_01 |
| 1 | OpenDrawing(150;250) |
| 2 | ChartData(0 6.7) |
| 3 | |
| 4 | 12%; /* Thickness relative to plot area width. */ |
| 5 | 0; /* Corner radius. */ |
| 6 | 0; /* Scale line offset. */ |
| 7 | 0; /* Major tick mark offset. */ |
| 8 | 0; /* Minor tick mark offset. */ |
| 9 | 0; /* Symbol offset. */ |
| 10 | 0; /* Bar gap relative to bar thickness. */ |
| 11 | 0; /* Bar shape. [0..16] */ |
| 12 | lightGray) /* Meter fill color. */ |
| 13 | /* Use style functions to control the appearance of bar(s) and symbol(s). */ |
| 14 | |
| 15 | BorderStyle(1;none) |
| 16 | /* Use scale and axis functions to control the appearance of the scale. */ |
| 17 | |
| 18 | AxisOptions(all;0) |
| 19 | AddText(75;225;"6.7";Verdana;12;bold;#666;center;;0;150) |
| 20 | ChartBackground(xy;#f3f6f2;0;0;;;2 2 2;lightGray) |
| 21 | ChartBackgroundOptions(10;20 20 30 20) |
| 22 |

| | LINEAR_METER_02 |
| 1 | OpenDrawing(250;150) |
| 2 | ChartData(0 7) |
| 3 | |
| 4 | 10%; /* Thickness relative to plot area height. */ |
| 5 | 0; /* Corner radius. */ |
| 6 | 0; /* Scale line offset. */ |
| 7 | 0; /* Major tick mark offset. */ |
| 8 | 0; /* Minor tick mark offset. */ |
| 9 | 0; /* Symbol offset. */ |
| 10 | 0; /* Bar gap relative to bar thickness. */ |
| 11 | 0; /* Bar shape. [0..16] */ |
| 12 | lightGray) /* Meter fill color. */ |
| 13 | /* Use style functions to control the appearance of bar(s) and symbol(s). */ |
| 14 | |
| 15 | BorderStyle(1;none) |
| 16 | /* Use scale and axis functions to control the appearance of the scale. */ |
| 17 | |
| 18 | AxisOptions(all;0) /* Hide scale. */ |
| 19 | AddText(217;79;"7/10";Arial;11;bold;#666;center;;0;150) |
| 20 | ChartBackground(xy;#f3f6f2;0;0;;;2 2 2;lightGray) |
| 21 | ChartBackgroundOptions(10;15 40 15 15) |
| 22 |

| | LINEAR_METER_03 |
| 1 | OpenDrawing(250;150) |
| 2 | ChartData(0 7.54) |
| 3 | |
| 4 | 20%; /* Thickness relative to plot area height. */ |
| 5 | 6; /* Corner radius. */ |
| 6 | 0; /* Scale line offset. */ |
| 7 | 0; /* Major tick mark offset. */ |
| 8 | 0; /* Minor tick mark offset. */ |
| 9 | 0; /* Symbol offset. */ |
| 10 | 0.4; /* Bar gap relative to bar thickness. */ |
| 11 | 0; /* Bar shape. [0..16] */ |
| 12 | #fafafa;0; /* Meter fill color. */ |
| 13 | 1;#666) /* Meter border. */ |
| 14 | /* Use style functions to control the appearance of bar(s) and symbol(s). */ |
| 15 | FillStyle(1;#4682b4) |
| 16 | BorderStyle(1;none) |
| 17 | ShadowStyle(all;0 0 3;lightGray) |
| 18 | /* Use scale and axis functions to control the appearance of the scale. */ |
| 19 | |
| 20 | |
| 21 | AxisMajorTicks(all;5;1;#666) |
| 22 | AxisMajorTickLabelStyle(all;Verdana;9;plain;#666) |
| 23 | |
| 24 | ChartBackground(xy;#f3f6f2;0;0;;;2 2 2;lightGray) |
| 25 | ChartBackgroundOptions(10;14 50 10 12) |
| 26 |

| | LINEAR_METER_04 |
| 1 | OpenDrawing(250;150) |
| 2 | ChartData(0 8;6.5) |
| 3 | |
| 4 | 20%; /* Thickness relative to plot area height. */ |
| 5 | 6; /* Corner radius. */ |
| 6 | 0; /* Scale line offset. */ |
| 7 | 0; /* Major tick mark offset. */ |
| 8 | 0; /* Minor tick mark offset. */ |
| 9 | 0; /* Symbol offset. */ |
| 10 | 0.4; /* Bar gap relative to bar thickness. */ |
| 11 | 6; /* Bar shape. [0..16] */ |
| 12 | #fafafa;0; /* Meter fill color. */ |
| 13 | 1;#666) /* Meter border. */ |
| 14 | /* Use style functions to control the appearance of bar(s) and symbol(s). */ |
| 15 | FillStyle(1;#499BC9) |
| 16 | BorderStyle(1;none) |
| 17 | ShadowStyle(1;0 0 3;lightGray) |
| 18 | SymbolStyle(2;bullet;7;1;darkYellow;shaded) |
| 19 | ShadowStyle(2;0) |
| 20 | /* Use scale and axis functions to control the appearance of the scale. */ |
| 21 | |
| 22 | |
| 23 | AxisMajorTicks(all;5;1;#666) |
| 24 | AxisMajorTickLabelStyle(all;Verdana;9;plain;#666) |
| 25 | ChartBackground(xy;#f3f6f2;0;0;;;2 2 2;lightGray) |
| 26 | ChartBackgroundOptions(10;14 12 10 12) |
| 27 |

| | LINEAR_METER_05 |
| 1 | OpenDrawing(250;150) |
| 2 | ChartData(0 8;6.5) |
| 3 | |
| 4 | 20%; /* Thickness relative to plot area height. */ |
| 5 | 6; /* Corner radius. */ |
| 6 | 0; /* Scale line offset. */ |
| 7 | 0; /* Major tick mark offset. */ |
| 8 | 0; /* Minor tick mark offset. */ |
| 9 | 0; /* Symbol offset. */ |
| 10 | 0.5; /* Bar gap relative to bar thickness. */ |
| 11 | 6; /* Bar shape. [0..16] */ |
| 12 | #fafafa;0; /* Meter fill color. */ |
| 13 | 1;#666) /* Meter border stroke and color. */ |
| 14 | /* Use style functions to control the appearance of bar(s) and symbol(s). */ |
| 15 | FillStyle(1;#499BC9) |
| 16 | BorderStyle(1;none) |
| 17 | ShadowStyle(1;0 0 3;lightGray) |
| 18 | SymbolStyle(2;barVertical;20;3;#D72729) |
| 19 | ShadowStyle(2;0) |
| 20 | /* Use scale and axis functions to control the appearance of the scale. */ |
| 21 | |
| 22 | |
| 23 | AxisMajorTicks(all;5;1;#666) |
| 24 | AxisMajorTickLabelStyle(all;Verdana;9;plain;#555) |
| 25 |

| | LINEAR_METER_06 |
| 1 | OpenDrawing(250;150) |
| 2 | ChartData(-0.35 0;0 0.82) |
| 3 | |
| 4 | 25%; /* Thickness relative to plot area height. */ |
| 5 | 8; /* Corner radius. */ |
| 6 | 0; /* Scale line offset. */ |
| 7 | 0; /* Major tick mark offset. */ |
| 8 | 0; /* Minor tick mark offset. */ |
| 9 | 0; /* Symbol offset. */ |
| 10 | 0.3) /* Bar gap relative to bar thickness. */ |
| 11 | /* Use style functions to control the appearance of bar(s) and symbol(s). */ |
| 12 | FillStyle(1;#4682b4 ) |
| 13 | FillStyle(2;#FF3B16 ) |
| 14 | |
| 15 | /* Use scale and axis functions to control the appearance of the scale. */ |
| 16 | |
| 17 | |
| 18 | AxisMajorTicks(all;0) |
| 19 | AxisMajorTickLabelTexts(all;"|u|") |
| 20 | AxisMajorTickLabelStyle(all;Verdana;9;plain;#666) |
| 21 | /* Use grid line and stripe functions to control the background behind the bar(s). */ |
| 22 | MajorGridLineWidths(all;all;1;0.25) |
| 23 | MajorGridLineColors(all;all;gray;lightGray) |
| 24 | ChartBackground(xy;#f3f6f2;0;0;;;2 2 2;lightGray) |
| 25 | ChartBackgroundOptions(10;14 12 10 12) |
| 26 |

| | LINEAR_METER_07 |
| 1 | OpenDrawing(250;150) |
| 2 | ChartData(0 7.5) |
| 3 | |
| 4 | 14%; /* Thickness relative to plot area height. */ |
| 5 | 0; /* Corner radius. */ |
| 6 | 0; /* Scale line offset. */ |
| 7 | 0; /* Major tick mark offset. */ |
| 8 | 0; /* Minor tick mark offset. */ |
| 9 | 0; /* Symbol offset. */ |
| 10 | 0.8) /* Bar gap relative to bar thickness. */ |
| 11 | /* Use style functions to control the appearance of bar(s) and symbol(s). */ |
| 12 | |
| 13 | BorderStyle(1;none) |
| 14 | /* Use scale and axis functions to control the appearance of the scale. */ |
| 15 | |
| 16 | |
| 17 | AxisMajorTicks(all;5;1;#666) |
| 18 | AxisMajorTickLabelStyle(all;Verdana;9;plain;#666) |
| 19 | /* Use grid line and stripe functions to control the background behind the bar(s). */ |
| 20 | MajorGridLineColors(all;all;red;red;red;green;green;green) |
| 21 | MajorGridStripeColors(all;all;red;red;orange;green;green) |
| 22 | ChartBackground(xy;#f3f6f2;0;0;;;2 2 2;lightGray) |
| 23 | ChartBackgroundOptions(10;16 12 10 12) |
| 24 |

| | LINEAR_METER_08 |
| 1 | OpenDrawing(250;150) |
| 2 | ChartData(7.5) |
| 3 | |
| 4 | 10%; /* Thickness relative to plot area height. */ |
| 5 | 0; /* Corner radius. */ |
| 6 | 0; /* Scale line offset. */ |
| 7 | 0; /* Major tick mark offset. */ |
| 8 | 0; /* Minor tick mark offset. */ |
| 9 | -12; /* Symbol offset. */ |
| 10 | 0.8) /* Bar gap relative to bar thickness. */ |
| 11 | /* Use style functions to control the appearance of bar(s) and symbol(s). */ |
| 12 | SymbolStyle(1;triangleDown;8;3;black;shaded) |
| 13 | ShadowStyle(1;1 1 3) |
| 14 | /* Use scale and axis functions to control the appearance of the scale. */ |
| 15 | |
| 16 | |
| 17 | AxisMajorTicks(all;5;1;#666) |
| 18 | AxisMajorTickLabelStyle(all;Verdana;9;plain;#666) |
| 19 | /* Use grid line and stripe functions to control the background behind the bar(s). */ |
| 20 | MajorGridLineColors(all;all;red;red;orange;green;green;green) |
| 21 | MajorGridStripeColors(all;all;red;orange;orange;green;green) |
| 22 | ChartBackground(xy;#f3f6f2;0;0;;;2 2 2;lightGray) |
| 23 | ChartBackgroundOptions(10;20 12 10 12) |
| 24 |

| | LINEAR_METER_09 |
| 1 | OpenDrawing(250;150) |
| 2 | ChartData(0 7.5;0 5;0 9) |
| 3 | |
| 4 | 25%; /* Thickness relative to plot area height. */ |
| 5 | 0; /* Corner radius. */ |
| 6 | 0; /* Scale line offset. */ |
| 7 | 0; /* Major tick mark offset. */ |
| 8 | 0; /* Minor tick mark offset. */ |
| 9 | 0; /* Symbol offset. */ |
| 10 | 0.5) /* Bar gap relative to bar thickness. */ |
| 11 | /* Use style functions to control the appearance of bar(s) and symbol(s). */ |
| 12 | |
| 13 | |
| 14 | /* Use scale and axis functions to control the appearance of the scale. */ |
| 15 | |
| 16 | |
| 17 | AxisMajorTicks(all;5;1;#666) |
| 18 | AxisMajorTickLabelStyle(all;Verdana;9;plain;#666) |
| 19 | AxisOptions(all;;2) /* Mirror scale. */ |
| 20 | /* Use grid line and stripe functions to control the background behind the bar(s). */ |
| 21 | MajorGridLineColors(all;all;red;red;red;green;green;green) |
| 22 | MajorGridStripeColors(all;all;red;red;orange;green;green) |
| 23 | AddText(56;68;"Group A";Verdana;8;plain;60 60 60;right) |
| 24 | AddText(56;78;"Group B";Verdana;8;plain;60 60 60;right) |
| 25 | AddText(56;88;"Group C";Verdana;8;plain;60 60 60;right) |
| 26 | ChartBackground(xy;#f3f6f2;0;0;;;2 2 2;lightGray) |
| 27 | ChartBackgroundOptions(10;10 15 10 50) |
| 28 |

| | LINEAR_METER_10 |
| 1 | OpenDrawing(250;150) |
| 2 | ChartData(-2.5 4;0) |
| 3 | |
| 4 | 20%; /* Thickness relative to plot area height. */ |
| 5 | 0; /* Corner radius. */ |
| 6 | 0; /* Scale line offset. */ |
| 7 | 0; /* Major tick mark offset. */ |
| 8 | 0; /* Minor tick mark offset. */ |
| 9 | 0; /* Marker offset. */ |
| 10 | 0.4; /* Bar gap relative to bar thickness. */ |
| 11 | 3) /* Bar shape. [0..16] */ |
| 12 | /* Use style functions to control the appearance of bar(s) and symbol(s). */ |
| 13 | FillStyle(1;#499BC9) |
| 14 | BorderStyle(1;none) |
| 15 | ShadowStyle(1;2 2 2;lightGray) |
| 16 | SymbolStyle(2;barVertical;20;2;#f3f6f2) |
| 17 | ShadowStyle(2;0) |
| 18 | /* Use scale and axis functions to control the appearance of the scale. */ |
| 19 | |
| 20 | |
| 21 | AxisMajorTicks(all;5;0.25;#367DA2) |
| 22 | AxisMajorTickLabelStyle(all;;;;#367DA2) |
| 23 | ChartBackground(xy;#f3f6f2;0;0;;;2 2 2;lightGray) |
| 24 | ChartBackgroundOptions(10;10) |
| 25 |

| | LINEAR_METER_11 |
| 1 | OpenDrawing(250;150) |
| 2 | ChartData(-0.65 0.77) |
| 3 | |
| 4 | 20%; /* Thickness relative to plot area height. */ |
| 5 | 0; /* Corner radius. */ |
| 6 | 0; /* Scale line offset. */ |
| 7 | 0; /* Major tick mark offset. */ |
| 8 | 0; /* Minor tick mark offset. */ |
| 9 | 0; /* Symbol offset. */ |
| 10 | 0.4; /* Bar gap relative to bar thickness. */ |
| 11 | 6) /* Bar shape. [0..16] */ |
| 12 | /* Use style functions to control the appearance of bar(s) and symbol(s). */ |
| 13 | |
| 14 | BorderStyle(1;none) |
| 15 | ShadowStyle(1;2 2 2;lightGray) |
| 16 | /* Use scale and axis functions to control the appearance of the scale. */ |
| 17 | |
| 18 | |
| 19 | AxisMajorTicks(all;5;0.25;#367DA2) |
| 20 | AxisMinorTicks(all;5;0.25;#367DA2) |
| 21 | AxisMajorTickLabelStyle(all;;;;#367DA2) |
| 22 | AxisMajorTickLabelTexts(all;"|u|") |
| 23 | /* Use grid line and stripe functions to control the background behind the bar(s). */ |
| 24 | MajorGridLineWidths(all;all;0.25) |
| 25 | MinorGridLineWidths(all;all;0) |
| 26 | MajorGridLineColors(all;all;#367DA2) |
| 27 | ChartBackground(xy;#f3f6f2;0;0;;;2 2 2;lightGray) |
| 28 | ChartBackgroundOptions(10;10) |
| 29 |

| | LINEAR_METER_12 |
| 1 | OpenDrawing(150;250) |
| 2 | ChartData(0 6.71) |
| 3 | |
| 4 | 20%; /* Thickness relative to plot area width. */ |
| 5 | 0; /* Corner radius. */ |
| 6 | 0; /* Scale line offset. */ |
| 7 | 0; /* Major tick mark offset. */ |
| 8 | 0; /* Minor tick mark offset. */ |
| 9 | 0; /* Symbol offset. */ |
| 10 | 0.4) /* Bar gap relative to bar thickness. */ |
| 11 | /* Use style functions to control the appearance of bar(s) and symbol(s). */ |
| 12 | FillStyle(1;#499BC9) |
| 13 | BorderStyle(1;none) |
| 14 | ShadowStyle(1;2 2 2;lightGray) |
| 15 | /* Use scale and axis functions to control the appearance of the scale. */ |
| 16 | |
| 17 | |
| 18 | AxisMajorTicks(all;5;0.25;#367DA2) |
| 19 | AxisMajorTickLabelStyle(all;;;;#367DA2) |
| 20 | AddText(78;225;"6.71";Verdana;12;bold;#888;center;;0;150) |
| 21 | ChartBackground(xy;#f3f6f2;0;0;;;2 2 2;lightGray) |
| 22 | ChartBackgroundOptions(10;10 10 30 15) |
| 23 |

| | LINEAR_METER_13 |
| 1 | OpenDrawing(250;150) |
| 2 | ChartData(3.35;7.44) |
| 3 | |
| 4 | 10%; /* Thickness relative to plot area height. */ |
| 5 | 0; /* Corner radius. */ |
| 6 | 0; /* Scale line offset. */ |
| 7 | 0; /* Major tick mark offset. */ |
| 8 | 0; /* Minor tick mark offset. */ |
| 9 | -10 0; /* Marker offsets. */ |
| 10 | 0.8) /* Bar gap relative to bar thickness. */ |
| 11 | /* Use style functions to control the appearance of bar(s) and symbol(s). */ |
| 12 | SymbolStyle(1;triangleDownOutline;10;1;darkRed) |
| 13 | SymbolStyle(2;bullet;6;1;black;shaded) |
| 14 | /* Use scale and axis functions to control the appearance of the scale. */ |
| 15 | |
| 16 | |
| 17 | AxisMajorTicks(all;7;1;#888) |
| 18 | AxisMinorTicks(all;3;1;#888) |
| 19 | AxisMajorTickLabelTexts(all;"|u|";"") |
| 20 | AxisMajorTickLabelStyle(all;Verdana;9;plain;#666) |
| 21 | /* Use grid line and stripe functions to control the background behind the bar(s). */ |
| 22 | MajorGridLineWidths(all;all;0) |
| 23 | MinorGridLineWidths(all;all;0) |
| 24 | MajorGridStripeColors(all;all;#ddd;#ddd;#ddd;#ddd;#ddd;#ddd;orange;orange;orange;red) |
| 25 | ChartBackground(xy;#f3f6f2;0;0;;;2 2 2;lightGray) |
| 26 | ChartBackgroundOptions(10;20 15 15) |
| 27 |

| | LINEAR_METER_14 |
| 1 | OpenDrawing(150;250) |
| 2 | ChartData(0 6.71) |
| 3 | |
| 4 | 10%; /* Thickness relative to plot area width. */ |
| 5 | 0; /* Corner radius. */ |
| 6 | 0; /* Scale line offset. */ |
| 7 | 3; /* Major tick mark offset. */ |
| 8 | 3; /* Minor tick mark offset. */ |
| 9 | 0; /* Symbol offset. */ |
| 10 | 0; /* Bar gap relative to bar thickness. */ |
| 11 | 0; /* Bar shape. [0..16] */ |
| 12 | lightGray) /* Meter fill color. */ |
| 13 | /* Use style functions to control the appearance of bar(s) and symbol(s). */ |
| 14 | FillStyle(1;#D72729) |
| 15 | BorderStyle(1;none) |
| 16 | /* Use scale and axis functions to control the appearance of the scale. */ |
| 17 | |
| 18 | |
| 19 | AxisMajorTicks(all;10;0.25;#666) |
| 20 | AxisMinorTicks(all;5;0.25;#666) |
| 21 | AxisMajorTickLabelTexts(all;"|u|";"") |
| 22 | AxisMajorTickLabelStyle(all;;;;#666) |
| 23 | AddText(82;225;"6.71";Verdana;12;bold;#666;center;;0;150) |
| 24 | ChartBackground(xy;#f3f6f2;0;0;;;2 2 2;lightGray) |
| 25 | ChartBackgroundOptions(10;20 20 35 20) |
| 26 |

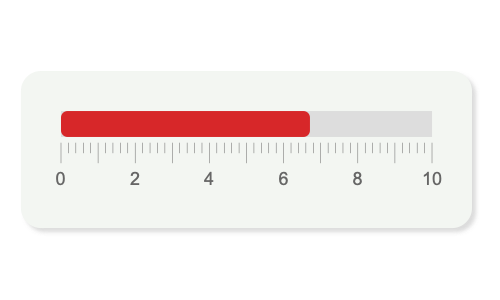
| | LINEAR_METER_15 |
| 1 | OpenDrawing(250;150) |
| 2 | ChartData(0 6.71) |
| 3 | |
| 4 | 10%; /* Thickness relative to plot area height. */ |
| 5 | 0; /* Corner radius. */ |
| 6 | 0; /* Scale line offset. */ |
| 7 | 3; /* Major tick mark offset. */ |
| 8 | 3; /* Minor tick mark offset. */ |
| 9 | 0; /* Symbol offset. */ |
| 10 | 0; /* Bar gap relative to bar thickness. */ |
| 11 | 6; /* Bar shape. [0..16] */ |
| 12 | lightGray;0; /* Meter fill color. */ |
| 13 | 0) /* Meter border. */ |
| 14 | /* Use style functions to control the appearance of bar(s) and symbol(s). */ |
| 15 | FillStyle(1;#D72729) |
| 16 | BorderStyle(1;none) |
| 17 | /* Use scale and axis functions to control the appearance of the scale. */ |
| 18 | |
| 19 | |
| 20 | AxisMajorTicks(all;10;0.25;#666) |
| 21 | AxisMinorTicks(all;5;0.25;#666) |
| 22 | AxisMajorTickLabelTexts(all;"|u|";"") |
| 23 | AxisMajorTickLabelStyle(all;;;;#666) |
| 24 | ChartBackground(xy;#f3f6f2;0;0;;;2 2 2;lightGray) |
| 25 | ChartBackgroundOptions(10;20) |
| 26 |
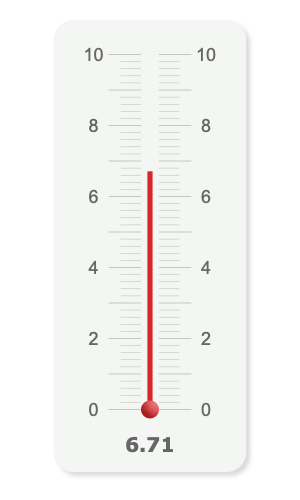
| | LINEAR_METER_16 |
| 1 | OpenDrawing(150;250) |
| 2 | ChartData(0; 0 6.71) |
| 3 | |
| 4 | 4%; /* Thickness relative to plot area width. */ |
| 5 | 0; /* Corner radius. */ |
| 6 | 0; /* Scale line offset. */ |
| 7 | 2; /* Major tick mark offset. */ |
| 8 | 2) /* Minor tick mark offset. */ |
| 9 | /* Use style functions to control the appearance of bar(s) and symbol(s). */ |
| 10 | SymbolStyle(1;bullet;8;1;#D72729;shaded) |
| 11 | BorderStyle(2;none) |
| 12 | FillStyle(2;#D72729) |
| 13 | /* Use scale and axis functions to control the appearance of the scale. */ |
| 14 | |
| 15 | |
| 16 | AxisOptions(all;;2) /* Mirror axis. */ |
| 17 | AxisMajorTicks(all;16;0.25;#999) |
| 18 | AxisMinorTicks(all;10;0.25;#bbb) |
| 19 | AxisMajorTickLabelTexts(all;" 0";"";" 2";"";" 4";"";" 6";"";" 8";"";"10") |
| 20 | AxisMajorTickLabelStyle(all;;;;#666) |
| 21 | AddText(75;226;"6.71";Verdana;10;bold;#666;center;;0;150) |
| 22 | ChartBackground(xy;#f3f6f2;0;0;;;2 2 2;lightGray) |
| 23 | ChartBackgroundOptions(10;16 15 30) |
| 24 |