Effects
- Shading
- Glow & Shadow
Shading
Shading can be applied to all charts and graphic elements and is activated by colorVariant = shaded. The argument colorVariant is part of numerous xmCHART functions. For example:
AddRect(10;10;200;100;steelBlue;shaded)
FillStyle(1;200 200 0;shaded)
FillColorScheme(classic;shaded)
FillColorScale(1;10;shaded)
Examples
| | EFFECTS_01 |
| 1 | OpenDrawing(450;100) |
| 2 | |
| 3 | AddRect(135;10;80;80;86 111 145;shaded;10;0 51 153;shaded) |
| 4 | |
| 5 | AddOval(360;10;80;80;darkYellow;shaded;10;110 110 110;shaded) |
| 6 |

| | EXAMPLE_02 |
| 1 | OpenDrawing(450;180) |
| 2 | |
| 3 | ChartData(10; 1 13; 5; 12 3 9; 18; 15; 14 4; 20 19 17; 16 7; 8; 2) |
| 4 | BarChart() |
| 5 | FillColorScheme(20;shaded) |
| 6 | BorderStyle(all;;0.25;0 0 0 25) |
| 7 | AxisOptions(all;none) /* Hide axes. */ |
| 8 | MajorGridLineWidths(all;all;0.25) |
| 9 | |
| 10 | |
| 11 | ChartData(2 3 5 8 27) |
| 12 | PieChart(;6.5;;306) |
| 13 | |
| 14 | BorderStyle(all;;0.25;0 0 0 25) |
| 15 | |
| 16 |

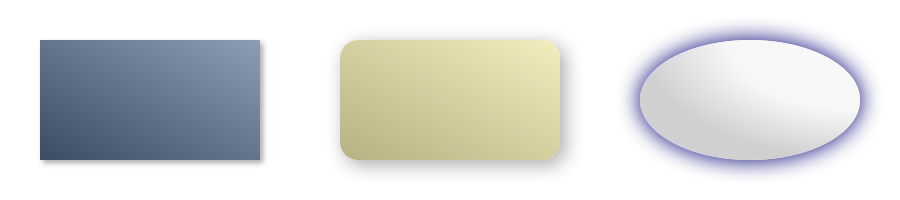
Glow & Shadow
Glow and shadow effects can be controlled by the arguments shadowEffect and shadowColor. The argument shadowEffect can have up to three values, i.e. the shadow offsets in x and y-direction and the blur radius. By varying these values subtle shadow and glow effects can be achieved. Glow and shadow effects can be added to all charts, texts and graphic elements. For example:
ShadowStyle(all;3 3 3;127 127 127 170) /* Default settings. */
ShadowStyle(all;2 2 4;gray)
LabelBackground(1;white;;0;;;0 0 10;darkBlue)
AxisLabelStyle(x;Arial;15;bold;40 40 40;;0;;;;0 0 3;darkGray)
Examples
| | EXAMPLE_03 |
| 1 | OpenDrawing(450;100) |
| 2 | |
| 3 | AddRoundRect(170;20;110;60;18;18;paleGoldenrod;shaded;0;;;3 3 10) |
| 4 | AddOval(320;20;110;60;whiteSmoke;shaded;0;;;0 0 12;darkBlue) |
| 5 |
| | EXAMPLE_04 |
| 1 | OpenDrawing(160;210) |
| 2 | AddPath(M 140 190 /* Move to: xPt yPt */ |
| 3 | L 140 20 /* Line to: xPt yPt */ |
| 4 | L 70 20 /* Line to: xPt yPt */ |
| 5 | A 20 70 50 50 0 0 0 /* Arc to: xEndPt yEndPt xRadius yRadius rotation flags */ |
| 6 | L 20 190 /* Line to: xPt yPt */ |
| 7 | Z /* Close (outer path) */ |
| 8 | M 40 150 L 60 150 L 60 170 L 40 170 Z /* Punch out square. */ |
| 9 | M 90 160 A 70 160 10 10 0 0 1 A 90 160 10 10 0 0 1 Z /* Punch out circle. */ |
| 10 | M 120 150 L 110 170 L 100 150 Z; /* Punch out triangle. */ |
| 11 | greenYellow;shaded; /* Fill: color ; colorVariant */ |
| 12 | 2.5;slateBlue;shaded; /* Border: width ; color ; colorVariant */ |
| 13 | 2 2 5) /* Shadow: xOffset yOffset blurRadius */ |
| 14 |

| | EXAMPLE_05 |
| 1 | OpenDrawing(220;70) |
| 2 | AddText(10;25;"こんにちは世界";ヒラギノ角ゴ Pro W3;20.5;3;slateBlue;;;;;;;1 1 2;gray) |
| 3 | AddText(10;60;"Text with shadow effect";Times New Roman;20;3;slateBlue;;;;;;;0 0 1;gray) |
| 4 |

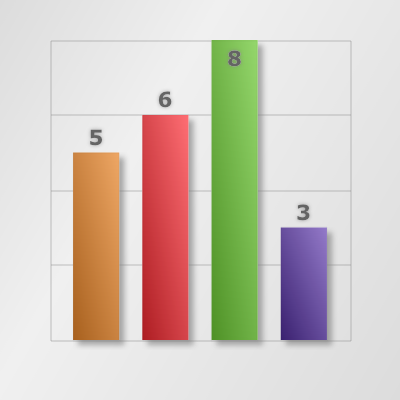
| | EXAMPLE_06 |
| 1 | OpenDrawing(200;200) |
| 2 | |
| 3 | ChartData(5;6;8;3) |
| 4 | |
| 5 | BorderStyle(all;;0.25;0 0 0 20) |
| 6 | |
| 7 | |
| 8 | |
| 9 | |
| 10 | AxisOptions(all;none) /* Hide axes. */ |
| 11 | MajorGridLineWidths(all;all;0.25) |
| 12 | LabelStyle(all;Verdana;10.5;bold;100 100 100;center;;;;;0 0 2) |
| 13 | |
| 14 | Background(1 30 1 |
| 15 | 0.0 220 220 220 255 |
| 16 | 0.35 240 240 240 255 |
| 17 | 1.0 220 220 220 255;; |
| 18 | 0) /* Hide border. */ |
| 19 |
| | EXAMPLE_07 |
| 1 | OpenDrawing(200;200) |
| 2 | |
| 3 | ChartData(1 2 5 4) |
| 4 | PieChart(;;;90) |
| 5 | BorderStyle(all;;0.25;0 0 0 25) |
| 6 | |
| 7 | |
| 8 | |
| 9 | |
| 10 | |
| 11 | AddOval(30;175;140;10;2 0.5 0.5 |
| 12 | 0 0 0 0 50 |
| 13 | 1 0 0 0 0) /* Shadow */ |
| 14 | Background(1 90 0 |
| 15 | 0.0 255 255 255 255 |
| 16 | 0.5 214 232 246 255 |
| 17 | 1.0 206 228 245 255;; |
| 18 | 0) /* Hide border. */ |
| 19 |
